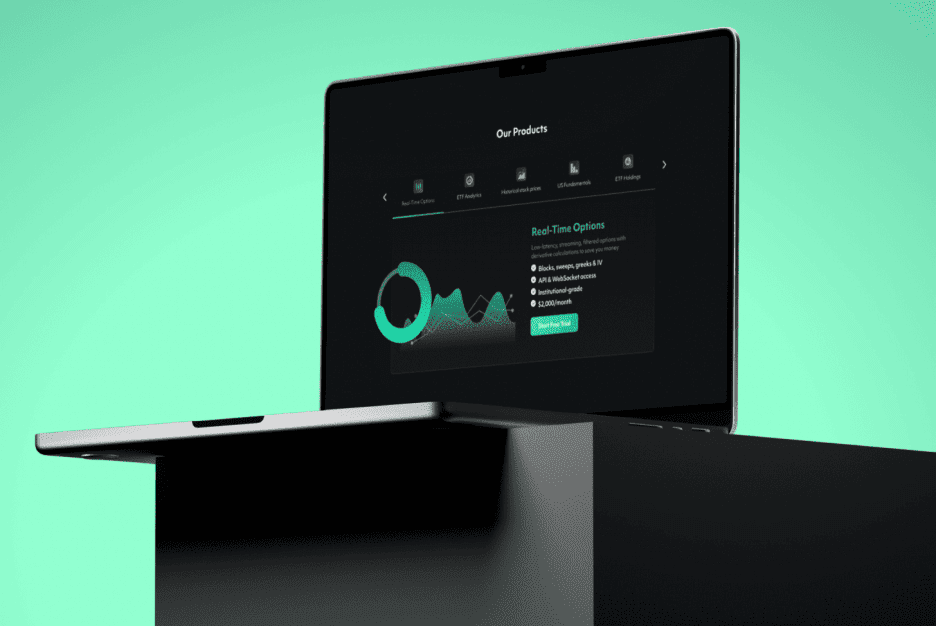
At Almax, we understand the importance of a well-designed B2B website company dashboard in helping businesses stay competitive. A dashboard serves as the central hub of your operations, bringing together data from multiple sources and presenting it in an easy-to-digest format. Whether you’re managing a fast-growing startup or a large enterprise rolling out new digital products, your dashboard should provide clear, actionable insights.
Whether you’re a startup or a large corporation, we understand how crucial it is to have a well-designed, user-friendly dashboard to optimize your digital products. Our services range from UI/UX design to mobile apps and custom-built websites.
In this post, we’ll break down the key features every B2B company dashboard should have and how these elements can streamline your processes and help you make better decisions.
The Basics: What Is a B2B Dashboard?
What is a B2B Dashboard?
A B2B dashboard is a centralized hub where b2b companies can monitor their performance metrics and track business processes in real time. Think of it as the control panel for your business, pulling in data from sources like CRMs, marketing platforms, and analytics tools to give you a comprehensive overview. For example, a B2B company might use its dashboard to track sales pipelines, measure B2B website traffic, and monitor customer support performance.
Let’s say you’re a SaaS company. You need to track monthly recurring revenue (MRR), churn rates, and the effectiveness of your onboarding process. A B2B dashboard allows you to visualize these metrics on one screen, enabling you to spot trends and act on insights immediately. Another example could be a logistics company using a dashboard to track deliveries, monitor fleet performance, and assess customer satisfaction ratings—all in real-time.
Dashboards simplify the way businesses handle data, ensuring that decision-makers and teams have the information they need without wading through complex spreadsheets or manual reports.

Intuitive User Interface (UI): Simplify Complex Processes
The Need for an Easy-to-Navigate Design
Imagine opening a dashboard that’s cluttered with data, tiny fonts, and too many widgets. It’s overwhelming, and you’re likely to miss the critical information you need. That’s why an intuitive user interface (UI) is essential. A well-designed dashboard uses a clean layout, logical grouping of data, and clear visual cues so that users can easily find the information they’re looking for.
For instance, a marketing manager might want to track the performance of specific ad campaigns. With a clean, intuitive UI, they can filter data quickly to see real-time campaign metrics without having to sift through unrelated information. A messy UI, on the other hand, could lead to missed opportunities or errors when interpreting the data.
Customizable Layouts to Fit Different Roles
Not everyone in your company will need access to the same data. A customer support team might focus on response times and satisfaction scores, while the sales department will want to track leads, opportunities, and conversions. A good dashboard should allow users to customize their layout based on their role, so each person can focus on the metrics most relevant to them.
For example, Salesforce dashboards allow users to create personalized views that display the most important KPIs for their specific role. A B2B dashboard that offers customizable views not only boosts productivity but also helps ensure that employees aren’t distracted by irrelevant data.
Reducing the Learning Curve for New Users
A dashboard should be easy enough for a new hire to navigate with minimal training. By incorporating good dashboard widgets—like collapsible menus, drag-and-drop functionality, and simple filters—companies can reduce the learning curve and make the onboarding process smoother. Avoiding bad UX reduces the time it takes for new users to become proficient and allows them to start contributing immediately.

Real-Time Data and Analytics: Empower Decision-Making
Real-Time Updates on KPIs and Metrics
In today’s fast-paced business environment, real-time data is crucial. Let’s say you run an e-commerce platform. Knowing exactly how many customers are browsing your site, which products they’re viewing, and how long they’re staying on your page can inform immediate changes to your marketing strategy. With real-time data, you can adjust your B2B website metrics on the fly, optimizing campaigns as they unfold.
For example, Netflix uses real-time data to analyze user behavior and adjust content recommendations almost instantly. Having this capability in your dashboard means you can react quickly, whether it’s adjusting pricing strategies, launching promotions, or identifying potential bottlenecks in your operations.
Custom Reporting Tools for Business Needs
Custom reporting is another must-have. Depending on your business, you’ll want to track specific data that may not be covered by a default dashboard setup. A good dashboard allows you to create custom reports based on your business’s unique metrics.
Imagine you’re running a B2B software company and want to track the performance of a new product feature. Custom reports can show you detailed engagement metrics, user adoption rates, and feature-specific revenue—all of which help inform future product development.
Customizable Permissions and Roles: Enhanced Security
Role-Based Access for Targeted Data Viewing
Not everyone in your company should have access to all the data. Sensitive financial information, for instance, should only be visible to a select group of employees. Customizable permissions allow admins to control who can view or modify specific sections of the dashboard.
Consider a company like Shopify, where different teams—from customer service to engineering—use the same dashboard but have access to different types of data. Role-based access ensures that employees only see what’s relevant to their work, preventing data breaches and reducing unnecessary distractions.
Granular Permission Settings for Security
Granular permission settings take it a step further by allowing businesses to control exactly which parts of the dashboard different users can interact with. For example, a marketing team may need access to B2B website traffic data but not to financial reports. This level of control improves both usability and security.
Seamless Integration with Third-Party Tools: Centralize Operations

Integrating with CRMs, ERPs, and Marketing Platforms
A powerful B2B website company dashboard integrates seamlessly with other tools like CRM systems, ERP platforms, and marketing automation software. When all your tools work together, your team can access a full range of data without having to switch between multiple platforms.
For example, HubSpot integrates with Google Analytics, Salesforce, and social media platforms, giving marketing teams a comprehensive view of their efforts from lead generation to conversion. Integrating third-party tools into your dashboard helps your team manage operations efficiently and makes it easier to make data-driven decisions.
If you’re looking for a trusted partner to build or enhance your B2B dashboard, platforms like GoodFirms can help you find top-rated, verified companies with proven expertise in delivering data-driven, customized solutions.
Single Sign-On for Convenience
Single sign-on (SSO) is another feature that enhances convenience by allowing users to log in once and access multiple platforms through a unified dashboard. This not only improves security but also reduces the time employees spend managing passwords.
Collaboration Features: Foster Team Communication
Built-In Messaging and Project Management Tools
Effective collaboration is key in any B2B setting. A b2b website company dashboard that includes built-in communication tools—such as messaging, file sharing, or even project management features—can significantly improve teamwork. For example, if your dashboard integrates with tools like Slack or Asana, team members can share reports, assign tasks, and track progress, all without leaving the dashboard.
Google’s G Suite is a great example of this integration in action, where collaboration tools like Google Docs and Sheets can be accessed directly within the same platform.
Real-Time Collaboration to Boost Efficiency
When teams can collaborate in real time, they make decisions faster and avoid delays. Let’s say your product development team is spread across different locations. A real-time collaboration feature allows them to make updates to product specs, see feedback instantly, and adjust timelines—all within the dashboard.
Mobile Optimization: Access Anytime, Anywhere

Responsive Design for Seamless Mobile Use
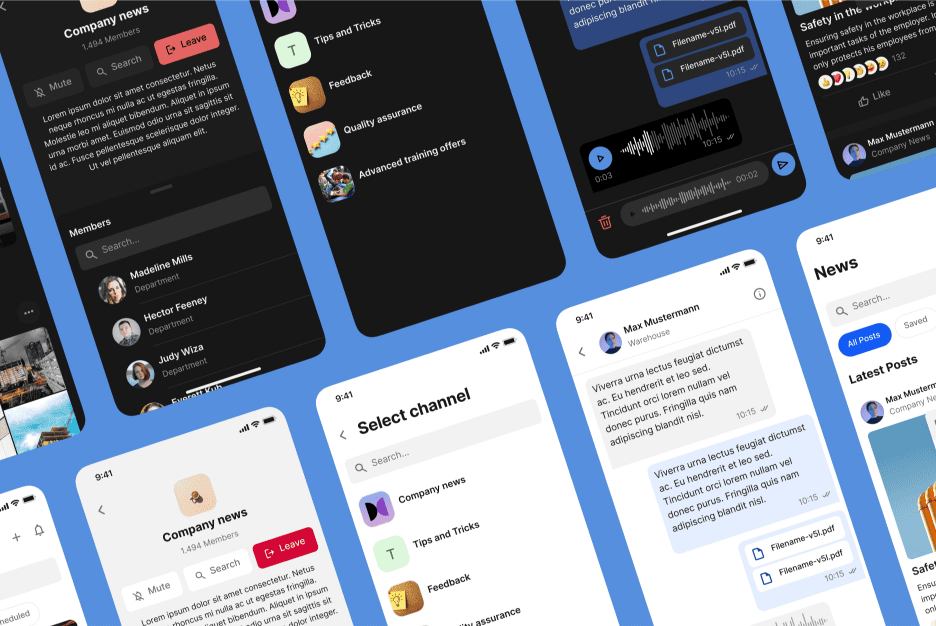
Mobile optimization isn’t just a nice-to-have anymore—it’s a necessity. If your team is working remotely or frequently on the move, having access to a mobile app or mobile-optimized dashboard allows them to stay connected to key metrics at all times.
For instance, Salesforce’s mobile app gives sales teams access to customer data, sales pipelines, and metrics directly from their smartphones, ensuring they’re always in the loop no matter where they are.
Enhancing Engagement with Mobile-First Designs
By adopting a mobile-first design, your dashboard will be accessible across devices without sacrificing functionality. Whether it’s tracking B2B website traffic or monitoring customer satisfaction scores, a mobile-optimized dashboard helps teams stay engaged and responsive.
User Support and Onboarding: Minimize Downtime
Tutorials, FAQs, and Live Support
A well-designed b2b website company dashboard should also include features that make onboarding new users easier. Tools like FAQs, video tutorials, and live support ensure that users can quickly get up to speed without relying on extensive training sessions.
For example, platforms like Zendesk offer in-depth tutorials and knowledge bases, allowing users to troubleshoot issues independently. This reduces downtime and increases productivity across your team.
Scalability and Flexibility: Future-Proof Your Platform
Evolving with Company Growth
As your company grows, so will your data needs. A good b2b website company dashboard should be scalable, allowing you to add new features, metrics, and integrations as your business evolves. For example, if you start as a small startup, your dashboard might initially track basic KPIs. But as you scale, you may need to monitor global operations, multiple product lines, or new revenue streams.
A dashboard with a creative design solution is essential for accommodating these growing demands without requiring a complete overhaul.
Adaptability and Custom Workflows
Custom workflows allow companies to adapt their dashboards to new processes or business goals. For instance, a growing company might want to automate certain repetitive tasks, like sending reports or alerts. A flexible dashboard that evolves with your business ensures that you stay efficient and productive as you scale.
Conclusion: B2B Website Company Dashboard
A well-designed B2B website company dashboard is more than just a data management tool—it’s a critical part of your company’s success. From intuitive user interfaces and real-time analytics to seamless integration with third-party tools, the right dashboard can significantly boost efficiency, security, and collaboration across your organization. Additionally, scalability and mobile optimization ensure that your dashboard grows alongside your business and remains functional across devices.
At Almax, we specialize in creating dashboards that are tailored to your company’s unique needs. Whether you’re tracking B2B website traffic, managing sales pipelines, or monitoring key business metrics, our solutions are designed to help you stay competitive. Contact Almax today to learn how we can elevate your B2B dashboard experience.
